
Design Robinhood – Frontend System Design
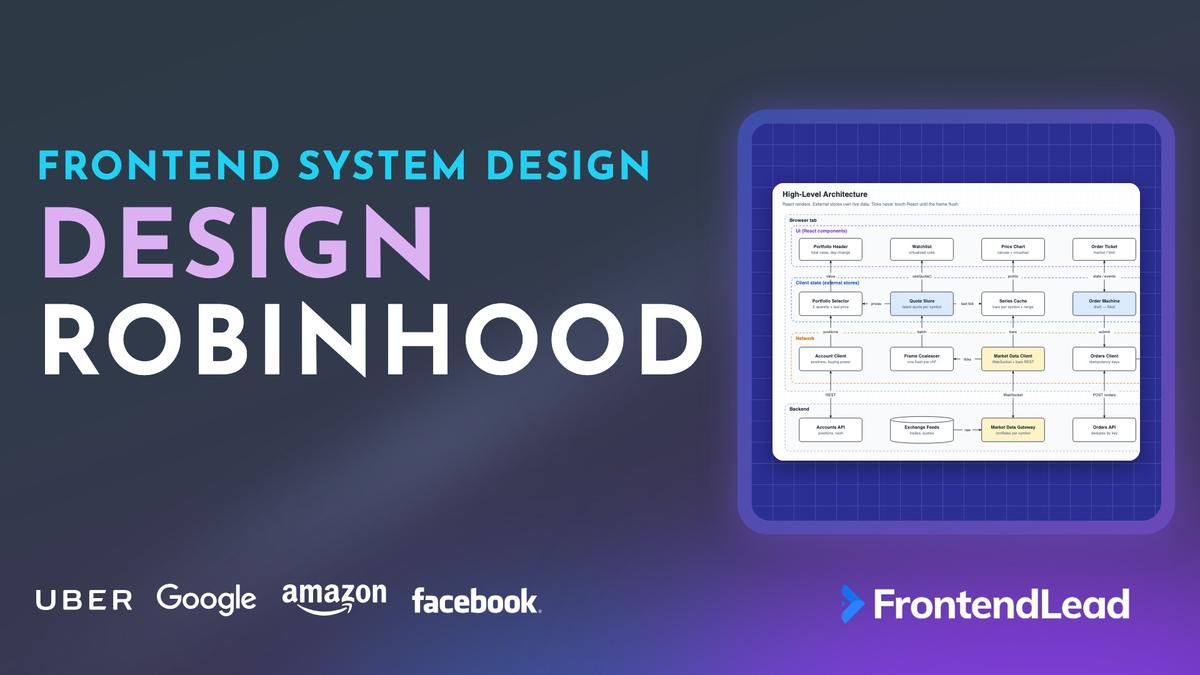
We’ll walk through the frontend system design for Robinhood: a stock trading web app where prices move several times a second, a chart follows your finger, and a Buy button moves real money. You’ll see how live quotes travel from an exchange to a table row without melting React, how a canvas chart stays at 60fps on a year of data, and how an order ticket guarantees that one tap places exactly one order.
This question looks like a dashboard. It isn’t. The interviewer is waiting for three things most candidates miss: you never render every tick, you never do money math in floating point, and you never let a network timeout turn into a duplicate order.
Problem Statement
Design the frontend for a stock trading web app like Robinhood.
Requirements:
- A watchlist with live prices and daily change for each symbol
- A stock detail page with an interactive price chart (1D, 1W, 1M, 1Y, 5Y)
- An order ticket for market and limit orders, buy and sell
- A portfolio header showing total value and today’s change, updating live
- Pre-market and after-hours prices shown separately from the regular session
- Correct behavior on flaky networks: reconnects, stale data, and retries
Describe the client architecture, the real-time data pipeline, the chart renderer, and the order flow.
Interviewers are checking three things. Can you design a real-time pipeline with explicit rate limits at each hop? Can you draw a chart that scrubs smoothly without re-rendering React on every pointermove? And can you model an order as a state machine with idempotent submission, instead of a button that calls fetch?
Clarifying Questions
| # | Question | Interviewer’s Answer |
|---|---|---|
| 1 | Web, native, or both? | Web app, desktop and mobile browsers. Native is out of scope. |
| 2 | Which assets? | US stocks and ETFs, including fractional shares. Options and crypto are out of scope. |
| 3 | How real-time do prices need to be? | Real-time for logged-in users. Under a second of latency is fine. Users don’t need every trade print. |
| 4 | Which order types? | Market and limit, buy and sell. Limit orders can be day or good-till-cancelled. Stops are out of scope. |
| 5 | Extended hours? | Show pre-market and after-hours prices on the chart. Extended-hours trading is limit orders only. |
| 6 | How large is a watchlist? | Up to about 50 symbols per list. Most users have a few lists. |
| 7 | Any compliance features in scope? | Payment for order flow, tax lots, and statements are out of scope. |
Question 3 is the big one. “Users don’t need every trade print” gives you permission to conflate on the server and coalesce on the client. That one answer turns a firehose into a bounded stream.
Question 2 decides your number types. Fractional shares mean quantities like 0.123456, so neither prices nor quantities can be JavaScript floats. Question 5 tells you the chart has more than one session, and that the order ticket must know what time it is in New York.
Requirements
Functional
- Watchlist rows show symbol, last price, and change since the previous close, with a direction arrow.
- Stock page shows a chart for 1D, 1W, 1M, 1Y, and 5Y. Dragging across it shows the price and time under the pointer.
- The 1D chart shows pre-market, regular, and after-hours segments, visually distinct.
- Order ticket: choose side, type (market or limit), quantity or shares, limit price, and time in force. Review before submit.
- Open orders show live status: pending, partially filled, filled, cancelled, or rejected. Pending orders can be cancelled.
- Portfolio header shows total account value and today’s change, recomputed as prices move.
- Market status badge: pre-market, open, after-hours, closed, and a stale warning when data may be old.
Non-Functional
- Price updates visible within 1 second of the exchange.
- The main thread never does more than one quote render pass per frame.
- Chart scrubbing at 60fps on a mid-range phone.
- Exactly-once order placement, even across timeouts, retries, double taps, and reloads.
- Exact money arithmetic. No rounding drift in totals.
- Stale data is always labeled. A price the user can trade on must never silently freeze.
The last requirement is the one that separates a trading app from a news site. A frozen price that looks live is worse than no price, because someone will trade on it.
Napkin Math
| Metric | Estimate | Calculation | So what? |
|---|---|---|---|
| Raw prints for a busy symbol | Hundreds / sec in bursts | Liquid large caps near the open and close | Never forward raw ticks to a browser. |
| Conflated rate per symbol | ≤ 10 / sec | Server keeps the latest quote, flushes every 100ms | Rate is bounded no matter how busy the market is. |
| Socket messages per client | ~200 / sec | 20 subscribed symbols × 10 / sec | Easy for one WebSocket. |
| Bandwidth | ~20 KB / sec | 200 × ~100 bytes of JSON | JSON is fine. Binary is an optimization, not a requirement. |
| Messages per frame | ~3.3 | 200 / 60 | Rendering per message means 200 React commits a second. Coalesce to 60. |
| 1D chart points | 960 | 16 hours (4:00 a.m. to 8:00 p.m. ET) × 60 one-minute bars | Fine to draw directly on canvas. |
| 1Y at one-minute bars | 98,280 | 252 trading days × 390 regular-session minutes | Never fetch this. Ask for daily bars (~252). |
| Float error | 0.30000000000000004 | 0.1 + 0.2 in IEEE 754 doubles | Money is integers or decimal strings. |
The pattern in that table: every hop has a rate limit. The exchange is unbounded, the server caps each symbol, the subscription caps the symbols, and the frame caps the renders. Say each number out loud in the interview.
Architecture

The client has three layers in the browser, and the key decision is that live data does not live in React state.
| Layer | Owns | Updates at | Talks to |
|---|---|---|---|
| UI (React) | Portfolio header, watchlist, chart, order ticket, market status | ≤ 60fps, only changed rows | Reads stores through hooks, sends intents |
| Client state | Quote store, portfolio selector, series cache, order machine, market clock | Once per frame flush | UI above, network below |
| Network | Market data socket, frame coalescer, account, orders, auth session | Every message | Backend services |
| Backend | Gateway, accounts, orders, auth | Server side | Exchange feeds and brokerage systems |
The quote store is a plain TypeScript object outside React. Components subscribe to one symbol each through useSyncExternalStore. A tick for TSLA wakes the TSLA row and nothing else. If quotes lived in a context provider or a single Redux slice, every tick would re-render every consumer.
REST data that changes slowly (positions, buying power, order history) can live in a normal query cache such as TanStack Query. Use the right tool per update rate: a query cache for seconds-to-minutes data, an external store for sub-second data.
“Ticks go into a store outside React. Each row subscribes to its own symbol, and the store flushes once per animation frame. React never sees more than 60 updates a second, no matter what the market does.”
Data Model

Two rules drive the model. Anything that is money or a share count arrives as a decimal string and is computed as a scaled integer. Anything that is only drawn (chart points) can be a float, because a sub-pixel error is invisible.
type Decimal = string; // exact, from the server: "189.4200", "0.250000"
type MarketSession = "PRE" | "REGULAR" | "POST" | "CLOSED";

interface Quote {
  symbol: string;
  last: Decimal;
  bid: Decimal;
  ask: Decimal;
  prevClose: Decimal;
  session: MarketSession;
  halted: boolean;
  ts: number;  // exchange time, epoch ms
  seq: number; // per symbol, increases monotonically
}

interface Position {
  symbol: string;
  quantity: Decimal;      // fractional shares, up to 6 decimals
  averageCost: Decimal;
  heldForOrders: Decimal; // shares reserved by open sell orders
}

type OrderStatus =
  | "draft" | "reviewing" | "submitted" | "pending"
  | "partially_filled" | "filled" | "cancelled" | "rejected";

interface Order {
  clientOrderId: string;  // idempotency key, created by the client
  id?: string;            // server id, set once accepted
  symbol: string;
  side: "BUY" | "SELL";
  type: "MARKET" | "LIMIT";
  quantity: Decimal;
  limitPrice?: Decimal;
  timeInForce: "DAY" | "GTC";
  status: OrderStatus;
  filledQuantity: Decimal;
  version: number;        // server-assigned, drops out-of-order updates
}

interface ChartSeries {
  symbol: string;
  range: "1D" | "1W" | "1M" | "1Y" | "5Y";
  t: Float64Array;          // epoch ms, ascending
  close: Float64Array;      // for drawing only
  sessionBreaks: number[];  // indexes where PRE / REGULAR / POST change
}
Why seq on every quote? After a reconnect, a snapshot and a live delta can race. Without a sequence number you can’t tell which one is newer, and an older price can overwrite a newer one.
Why clientOrderId? The client creates the order’s identity before the server knows about it. That id is the idempotency key, and it is also how you find the order again if the response never arrives.
Why is PortfolioValue derived? It is a pure function of positions, cash, and quotes. Storing it creates a second source of truth that drifts. Recompute it once per frame flush. With 30 positions that is 30 integer multiplications, which costs nothing.
Money as integers
A price can have four decimals (sub-penny quotes are allowed under $1) and a quantity can have six. Parse each into a bigint at a fixed scale, multiply, and round once at the end.
Put this in one small money module that every screen imports. It has three jobs.
- Parse. Turn a decimal string into a scaled integer: prices at 104 (one unit is $0.0001) and quantities at 106. Reject anything that is not a plain decimal or has more decimals than the scale allows. Silent truncation is how a sub-penny price turns into a wrong total.
- Multiply. Quantity units times price units gives a product at scale 1010. Convert to whole cents with one half-up rounding step at the very end.
- Format. The only place money becomes a
numberis the formatter, using one sharedIntl.NumberFormatcreated at module scope.
bigint matters here, not just integers. 1,000 shares at $500 is 109 × 5×106 = 5×10¹⁵ units, which is already close to Number.MAX_SAFE_INTEGER (about 9×10¹⁵). A larger position would silently lose precision as a number.
Live Quotes Deep Dive

The pipeline has eight steps, and each one exists to bound work. Walk through them in order.
- Exchange prints. Unbounded and bursty. The browser must never see this stream.
- Gateway conflation. For each symbol, the server keeps only the latest quote and flushes at most every 100ms. A thousand prints in that window become one message.
- WebSocket frame. The gateway sends only symbols this connection subscribed to.
- onmessage. Parse, validate the shape, and drop anything with a
seqat or below the last one seen for that symbol. - Coalescer. Write the quote into a
Mapkeyed by symbol. Overwrite, never append. - requestAnimationFrame. The first message in a frame schedules one flush. Later messages in the same frame only update the Map.
- Quote store. Apply the batch and notify listeners for the changed symbols only.
- Memoized rows. Each row re-renders when its own symbol changed.
Subscriptions follow the viewport
A watchlist of 50 symbols with 12 visible rows should subscribe to about 12 symbols, plus the open chart’s symbol and anything in the portfolio header. With a virtualized list, the rows that are mounted are the rows that are visible (plus a small overscan). So the simplest correct rule is: a row retains its symbol on mount and releases it on unmount.
Several components can want the same symbol at once (the row, the chart, the portfolio header). Reference-count it, and send the server a diff, debounced so a fast scroll doesn’t produce a subscribe and unsubscribe for every row that flies past.
type ClientMessage =
  | { type: "subscribe"; symbols: string[] }
  | { type: "unsubscribe"; symbols: string[] };
A subscription manager owns this. It keeps a reference count per symbol and the set of symbols it last sent to the server.
- Retain increments the count and returns a release function, so a row can use it directly as an effect cleanup. Release is idempotent, so a double cleanup can’t drive a count negative.
- Every change schedules a debounced flush (about 250ms). The flush diffs the wanted set against the sent set and sends at most one subscribe and one unsubscribe message.
- On every socket open, the manager forgets what it sent and flushes the full set. A new connection starts with no subscriptions on the server.
The debounce is the trade-off. A fast fling through 50 rows produces one diff instead of 100 messages, at the cost of a quarter second before a newly visible row gets live prices. Show the last snapshot value in the meantime.
Coalescing to one update per frame
At 200 messages a second, calling setState per message means about 3 renders per frame, and most of them are thrown away before the browser paints. The fix is a Map that holds only the latest quote per symbol and a single requestAnimationFrame flush.
Two pieces own this, and both live outside React.
- The coalescer is a
Mapfrom symbol to the latest quote, plus one pending animation frame id. Each socket message overwrites its symbol’s entry and schedules a frame only if none is pending. - The quote store holds the current quote per symbol and a listener set per symbol. On flush it applies the batch, skips any quote whose
seqis not newer than what it has, and notifies only the listeners of symbols that actually changed.
Components read through a useQuote(symbol) hook built on useSyncExternalStore. It subscribes to one symbol and returns that symbol’s quote. A row for AAPL never re-renders because TSLA ticked. Keeping the store outside React state is the key decision: React sees one batched notification per frame, not one setState per message.
Three properties fall out of this design for free.
- Bounded memory in background tabs. Browsers pause
requestAnimationFramein hidden tabs. Messages keep arriving, but the Map holds one entry per symbol, so it can’t grow without limit. When the tab becomes visible, the first frame paints the latest prices. - One React commit per frame. React 18 batches all state updates triggered in the same task, so notifying 15 rows in one flush is one render pass.
- Snapshots are cheap. A reconnect snapshot with 50 quotes lands in the Map in one task and costs one commit.
If parsing ever shows up in a profile (thousands of messages a second, or a large binary payload), move the socket and the coalescing Map into a dedicated Web Worker and postMessage one batch per frame. At 200 small JSON messages a second, the main thread is fine. Say that you would measure before moving it.
Rendering a price change
A row compares the new last price with the previous one it rendered (kept in a useRef) and briefly flashes green or red. Run the flash with a CSS class and a short transition on background-color, not with JavaScript timers per row. Under prefers-reduced-motion: reduce, skip the flash and keep the arrow.
The daily change is computed from last and prevClose, both decimal strings. Keep the formatting work small: one Intl.NumberFormat instance per format, created once at module scope. Creating a formatter per render is a common hidden cost in tables that update often.
Price Chart Deep Dive

Canvas, not SVG
An SVG chart with 960 points is one <path>, which is fine. The problem is the crosshair. Scrubbing at 60fps means redrawing a line, a dot, and a label every frame, and you don’t want any of that going through React reconciliation or SVG layout. Canvas 2D gives you direct control over what repaints.
Use two stacked <canvas> elements. The bottom one draws the series, gridlines, and session shading. It repaints only when the data, range, or size changes. The top one draws only the crosshair, and it is the only thing that repaints during a scrub.
Size the backing store for the screen: set canvas.width to the CSS width × devicePixelRatio, then call ctx.setTransform(dpr, 0, 0, dpr, 0, 0) so you can draw in CSS pixels. A ResizeObserver on the container tells you when to redraw.
Ranges and the server-side interval
The cheapest point to draw is the one you never download. The client asks for a range, and the server picks a bar interval that gives a few hundred points.
| Range | Interval | Points | Live updates |
|---|---|---|---|
| 1D | 1 minute | Up to 960 with extended hours | Update the last bar from the quote store |
| 1W | 10 minutes | ~480 | Refetch the last bar every interval |
| 1M | 1 hour | ~340 | Same |
| 1Y | 1 day | ~252 | Only today’s bar changes |
| 5Y | 1 week | ~260 | Only this week’s bar changes |
These intervals are a common mapping, not a standard. The point is that each range returns hundreds of points, not tens of thousands. Cache series by (symbol, range) so switching between 1D and 1Y and back is instant.
For the 1D chart, the live price extends the current minute bar. The series cache subscribes to the quote store for the open symbol: if the quote’s timestamp falls in the current minute, update that bar’s close, otherwise append a new bar.
Downsampling with LTTB
Even a 960-point series is more than a 320px-wide phone chart can show. Taking every third point (fixed stride) is fast but drops spikes, and spikes are exactly what a trader wants to see. Largest-Triangle-Three-Buckets (LTTB) keeps them.
LTTB splits the series into buckets, always keeps the first and last points, and from each bucket picks the point that forms the largest triangle with the previously picked point and the average of the next bucket. Big moves form big triangles, so they survive.
Treat LTTB as a pure function in a chart data module. Input: a sorted series of (time, value) points and a target point count. Output: a subset of the original points, never synthesized ones, so every point on the chart is a real price the user can scrub to. If the target is at least the input length, return the series unchanged. Each bucket is scanned once and compared against the average of the next bucket, so the whole pass is linear.
It is O(n), so 960 points take microseconds. Run it when the series or the chart width changes, never per frame. Target about one point per CSS pixel of width.
LTTB is for line charts. For candlesticks, don’t pick points; re-aggregate bars into a coarser interval instead: open of the first, max of the highs, min of the lows, close of the last, sum of the volumes. Dropping a candle would hide a high or a low.
Crosshair scrubbing at 60fps
Scrubbing has two costs: finding the nearest point and drawing it. Finding is a binary search over the sorted t array, which is O(log n). Drawing happens at most once per frame, no matter how many pointermove events arrive.
The crosshair layer owns scrubbing, and it is deliberately separate from React.
- Pointer events only record the latest pointer x and schedule one animation frame if none is pending. Moving the pointer 300 times a second still costs one draw per frame.
- The frame converts x to a time, binary searches the sorted timestamps for the nearest sample, clears the overlay canvas, and draws the vertical line and the dot.
- It reports the scrubbed index (or nothing on
pointerleave) through a callback, so the price header can switch between the scrubbed price and the live price.
Store timestamps in a Float64Array alongside the close prices. The binary search then runs over contiguous memory with no object allocation per event.
While scrubbing, the big price at the top of the page shows the scrubbed price instead of the live one. Write that header through a ref (set textContent) or a tiny component that subscribes to the scrub index, so the rest of the page doesn’t re-render at 60fps.
On touch devices, set touch-action: pan-y on the chart so vertical swipes still scroll the page while horizontal drags scrub. Call setPointerCapture on pointerdown so a drag that leaves the chart keeps scrubbing.
The after-hours segment
The 1D chart covers three sessions. Draw regular hours as a solid line and pre-market and after-hours as a lighter or dashed line, with shaded backgrounds. sessionBreaks holds the indexes where the session changes, so the renderer draws each segment with its own style in one pass.
Daily change has two numbers after the close: the regular-session change (close vs previous close) and the after-hours change (last vs today’s close). Show both. Using one number for both is a common bug.
Orders Deep Dive

An order is a state machine, not a boolean isSubmitting. The client owns three states. Once the server accepts the order, only server events move it.
| State | Owner | Ticket shows | Leaves on |
|---|---|---|---|
| draft | Client | Editable fields, live estimate | Review |
| reviewing | Client | Summary, estimated cost, buying power after | Edit or Confirm |
| submitted | Client | Spinner, button disabled | 201, 4xx, or retry |
| pending | Server | “Order placed”, Cancel button | Fill, cancel, reject |
| partially_filled | Server | Filled 40 of 100 | More fills or cancel of the rest |
| filled / cancelled / rejected | Server | Final result | Never (terminal) |
Validation before submit
The ticket validates on the client for fast feedback, but the server is the authority. The client checks:
- Buying power. For a limit buy, quantity × limit price must not exceed buying power. For a market buy, there is no fixed price, so a common approach is to estimate with the ask plus a buffer (for example 5%) and show that the estimate is an estimate.
- Sellable shares. A sell can’t exceed
quantity - heldForOrders. Shares already reserved by another open sell order are not available. - Session. Outside regular hours, only limit orders are accepted. A market order typed at 7:55 p.m. ET should be blocked with an explanation, not rejected after submit.
- Limit price sanity. Warn when a limit price is far from the last price. It is usually a typo.
- Halted symbol. If
quote.haltedis true, explain that the order will wait until trading resumes or block it.
All checks go through the money module. Comparing "10.10" and "9.99" as strings, or as floats after multiplication, is how buying power checks end up off by a cent.
Idempotent submission
Here is the scenario the interviewer is waiting for. The user taps Buy. The request reaches the server and the order is placed, but the response is lost (tunnel, Wi-Fi handoff, timeout). The client doesn’t know if the order exists. If it retries naively, or the user taps again, they buy twice.
The fix is an idempotency key. Generate it with crypto.randomUUID() when the ticket enters reviewing, store it on the draft (and in sessionStorage so a reload keeps it), and send it with every attempt in an Idempotency-Key header. The server stores the first result per key and returns it for any repeat. The header is the one Stripe popularized and the IETF is standardizing.
type SubmitResult =
  | { kind: "accepted"; order: Order }
  | { kind: "rejected"; code: string; message: string }
  | { kind: "unknown" }; // reconcile by clientOrderId before showing anything final
The orders client wraps POST /api/orders and returns one of those three results. Its retry policy is the design.
- Every attempt sends the same idempotency key, plus a CSRF token, with a 10-second timeout.
- A success returns
accepted. A 4xx other than 409 or 429 is a real business rejection (insufficient buying power, invalid price) and returnsrejectedwith the server’s code. - Timeouts, network errors, 409 (the first attempt with this key is still processing), 429, and 5xx are retried up to three times with exponential backoff.
- If retries run out, the result is
unknown, neverrejected.
Two details are worth saying. Aborting a fetch stops the client from waiting; it does not un-place an order on the server. And unknown is a real outcome: the ticket shows “Checking your order…” and calls GET /api/orders?clientOrderId=... until it gets an answer. Never show “failed” for an order you can’t prove failed.
Disabling the button after the first tap is good UX, but it is not the guarantee. Two tabs, a reload, or a retry all bypass a disabled button. The key is the guarantee.
Applying server updates
After acceptance, the order moves on order_update events from the socket. Updates can arrive out of order, twice, or before the HTTP response (a market order can fill in milliseconds). A transition table plus a version check handles all three.
interface OrderUpdate {
  clientOrderId: string;
  orderId: string;
  status: OrderStatus;
  filledQuantity: Decimal;
  version: number;
}
The order machine applies each update with two checks.
- Version. If the update’s version is not greater than the order’s, it is a duplicate or arrived late. Ignore it.
- Transition. Look up the allowed next states for the current status in a static transition table that mirrors the state table above. An update for a
submittedorder is treated as coming frompending, because any server event proves the server accepted it. That covers the fill that arrives before the HTTP response.
An impossible transition is not applied and not thrown. It triggers a refetch of that order by clientOrderId, because the server copy is the truth and the client missed something. Terminal states have no outgoing transitions, so a late pending can never resurrect a filled order.
Cancel is a request, not a state. Clicking Cancel sends POST /api/orders/:id/cancel and shows “Cancelling…”, but the order stays pending or partially_filled until the server says cancelled. Fills can arrive while the cancel is in flight, and the final state might be filled. Explaining that race is a strong senior signal.
A day limit order that doesn’t fill by the close ends as cancelled (some APIs call it expired). Show the reason, not just the state.
State and Data Flow
Put the pieces together and every user-visible number has one source and one path.
- Startup. Fetch account, positions, and open orders over REST. Open the socket, authenticate, and subscribe to the portfolio and visible watchlist symbols.
- Snapshot first. On subscribe, the gateway sends a full quote per symbol with its
seq. Deltas follow. The UI shows prices only after the snapshot, not zeros or blanks pretending to be prices. - Every frame. The coalescer flushes to the quote store. Rows, the chart’s last bar, and the portfolio selector read from it.
- Portfolio value. The selector computes cash + Σ quantity × last in cents. It is memoized on the quote store version, so it runs at most once per frame.
- Orders. The ticket dispatches events into the order machine. The machine calls the orders client. Fills update the order and trigger a positions refetch.
Day change for the portfolio is Σ quantity × (last − previous close), with one exception you should mention: shares bought today use the purchase price, not the previous close, as their baseline. The cleanest answer is to let the server send each position’s day-change baseline and keep the client arithmetic simple.
Market hours and time zones
US equity sessions are defined in New York time: pre-market from 4:00 a.m., regular hours 9:30 a.m. to 4:00 p.m., after-hours until 8:00 p.m. ET. Some days close early at 1:00 p.m. ET, and exchange holidays close all day. None of that can be computed from the user’s local clock.
Fetch a market calendar from the server (open and close per date, including early closes) and convert instants with Intl.DateTimeFormat and the America/New_York zone. That handles daylight saving automatically. Never hard-code a UTC offset; New York is UTC−5 in winter and UTC−4 in summer.
The market clock is a small pure function. Create one formatter with timeZone: "America/New_York" and hourCycle: "h23", call formatToParts(epochMs) to get the ET date and minutes after midnight, look up that date in the calendar, and compare the minutes with the day’s pre-open, open, close, and post-close. A date missing from the calendar is CLOSED. The h23 option matters: with hour12: false, some engines format midnight as 24.
Pass in server time, not raw Date.now(). Estimate the clock offset from server timestamps (the snapshot’s ts or a Date header) and add it. A laptop with a clock five minutes fast would otherwise show “Market open” at 9:25.
Reconnect: snapshot, then resubscribe
The browser’s WebSocket API can’t send protocol-level ping frames, so use an application heartbeat. The server sends a heartbeat every 5 seconds; if the client hears nothing for 10 seconds, it treats the socket as dead even if readyState still says OPEN. That catches the classic laptop-sleep case where the TCP connection died silently.
- Mark the connection stale immediately. Every price on screen gets a stale treatment.
- Reconnect with exponential backoff and full jitter (random delay between 0 and min(30s, 1s × 2attempt)), so a gateway restart doesn’t get a synchronized stampede from every client.
- On open: authenticate, then have the subscription manager resend every retained symbol. The server sends a fresh snapshot per symbol. The
seqcheck discards anything older. - Refetch open orders over REST. Order updates sent while you were offline are gone, and fills are not something you can miss.
- Clear the stale state only after the snapshot arrives.
The same steps apply to the online event and to visibilitychange after a long hidden period. If the tab was hidden for more than a few minutes, a common approach is to unsubscribe entirely and resubscribe with a snapshot on return, which saves the server and the battery.
Stale indicators
Staleness is a property of the connection, not of one symbol. A thinly traded stock can go a minute without a trade during market hours, and that is not stale. A missed heartbeat makes every number on screen suspect.
- Connection stale: gray out prices, show “Reconnecting…” in the status badge, and require a fresh quote before the ticket allows a market order.
- Market closed: not stale. Show “At close” or “After hours” with the last quote time, in ET.
- Symbol halted: show “Halted” on the row and the ticket. The price is old because trading has stopped, which the user needs to know.
API
Two transports. REST for request-response and anything that must be acknowledged. One authenticated WebSocket for quotes and order updates.
// REST (money and quantities are decimal strings)
GET  /api/account                          // { cash, buyingPower, pendingDebits }
GET  /api/positions                        // Position[]
GET  /api/orders?status=open               // Order[]
GET  /api/orders?clientOrderId=:key        // reconcile an unknown submit
POST /api/orders                           // Idempotency-Key header, returns 201 Order
POST /api/orders/:id/cancel                // 202: cancel requested, not cancelled
GET  /api/bars/:symbol?range=1D            // { interval, t[], o[], h[], l[], c[], v[], sessionBreaks[] }
GET  /api/market/calendar?from=&to=        // trading days, early closes

// WebSocket: wss://stream.example.com
type ClientMessage =
  | { type: "auth"; ticket: string }               // short-lived, from POST /api/stream-ticket
  | { type: "subscribe"; symbols: string[] }
  | { type: "unsubscribe"; symbols: string[] };

type ServerMessage =
  | { type: "snapshot"; quotes: Quote[] }
  | { type: "quote"; quote: Quote }
  | { type: "order_update"; update: OrderUpdate }
  | { type: "session"; session: MarketSession }
  | { type: "heartbeat"; serverTime: number }
  | { type: "error"; code: "UNAUTHORIZED" | "TOO_MANY_SYMBOLS"; message: string };
Cap symbols per connection on the server (for example 200) and return TOO_MANY_SYMBOLS past it. A bug in the subscription code should fail loudly, not quietly subscribe to the whole market.
Order updates ride the same socket on a per-user channel because they need low latency, but they are not the source of truth. The REST order list is. The socket tells you when to look; REST tells you what is true after a gap.
Optimizations
| Problem | Technique | Effect |
|---|---|---|
| Firehose of trade prints | Server conflation per symbol | ≤ 10 messages / sec / symbol |
| Subscribed to symbols nobody sees | Ref-counted, viewport-driven subscriptions | ~20 symbols instead of 50+ |
| React commit per message | Map coalescer + rAF flush | ≤ 60 commits / sec |
| Every row re-renders on any tick | useSyncExternalStore per symbol + React.memo |
Only changed rows render |
| Chart redraw while scrubbing | Separate overlay canvas, rAF-throttled | One line and one dot per frame |
| Too many points for the width | Interval per range + LTTB | ~1 point per CSS pixel |
| Formatter churn in tables | Module-level Intl.NumberFormat |
No allocation per cell per tick |
| Slow first paint of the stock page | Prefetch 1D bars on watchlist row hover | Chart is ready on click |
Watchlists of 50 rows don’t strictly need virtualization, but long screener lists do, and virtualization is also what makes viewport-driven subscriptions free. For the patterns behind a large live grid, see the Google Sheets design.
Handling Edge Cases
- Double submit across tabs. Each tab’s draft has its own key, so two tabs can legitimately place two orders. Broadcast order updates between tabs with
BroadcastChannelso both show the new open order immediately and the user sees what they did. - Fill races cancel. The user cancels a limit order as it fills. The final state is
filled. The UI must show that clearly, not “cancelled” followed by a surprise position. - Response arrives after the fill event. The socket delivered
filledbefore the POST returned. The version check keepsfilled; the late 201 only sets the server id. - Stock split overnight. Positions double, average cost halves, and historical bars must be split-adjusted. Refetch positions and drop cached series when the server reports a corporate action.
- Early close and holidays. The calendar says 1:00 p.m. close; the badge and order validation follow it. Hard-coded 4:00 p.m. logic gets the day after Thanksgiving wrong.
- Daylight saving switch. The 1D chart’s x-axis is built from ET instants via
Intl, so labels stay correct on the Monday after the clocks change. - Sub-penny prices. A $0.4523 stock needs four decimals in display and in math. The price scale of 10,000 handles it.
- Market order with no ask. After a halt or in an illiquid name there may be no quote to estimate with. Block the market order and suggest a limit order.
- Long-lived tab. A tab open over the weekend must refresh the calendar, the session, and the auth session on Monday morning, not trust Friday’s state.
Accessibility and Security
Accessibility
Live prices are a trap for screen readers. If every price cell is an aria-live region, a screen reader user hears a never-ending stream of numbers and can’t use the page.
- Price cells are not live regions. A user who focuses a row hears its current values through a label like “Apple, 194 dollars 10 cents, up 1.63 percent”.
- Use one
aria-live="polite"region for events the user caused or must know about: “Order filled: 10 shares of AAPL at $194.10”, “Connection lost, prices may be out of date”. - Never use color alone. Pair green and red with an arrow (▲ ▼) and a sign (+1.63%, −0.82%). Around 1 in 12 men has some form of color vision deficiency, and red-green is the most common.
- The chart canvas gets
role="img"and a label summarizing the range: “AAPL, 1 day, from $190.98 to $194.10, high $194.60”. Offer the same data as a table for screen reader users. - Make the crosshair keyboard-operable: focus the chart, then Left and Right move one point, Home and End jump to the ends. Reuse the same
onScrubpath. - Respect
prefers-reduced-motionfor price flashes and chart transitions.
Security
- No secrets in the client. Market data vendor keys and brokerage credentials stay on the server. The browser talks only to your gateway, which is also where data licensing is enforced.
- Session cookies. Keep the session in an
HttpOnly,Secure,SameSite=Lax(orStrict) cookie, not inlocalStoragewhere any injected script can read it. - CSRF. Every state-changing request (place order, cancel, transfer) carries a CSRF token header, and the server also checks the
Originheader.SameSiteis a layer, not the whole defense. - WebSocket hijacking. WebSockets are not covered by CORS, and the handshake carries cookies. The server must check
Originon the handshake. Authenticating with a short-lived ticket from a REST call is a common extra layer. - Re-auth for trades. Require step-up authentication (a passkey via WebAuthn, or an MFA code) after a period of inactivity or before sensitive actions like large orders and bank transfers.
- Clickjacking. Send
Content-Security-Policy: frame-ancestors 'none'so no other site can frame your Buy button under a fake UI. - Script supply chain. A strict CSP and no third-party scripts on trading and account pages. An analytics script compromised on a trading page can place orders as the user.
Payment for order flow and best-execution routing are business and regulatory topics. Mention that they exist on the backend and that they are out of scope for the frontend design.
What a Strong Answer Sounds Like
| Topic | Junior answer | Senior answer |
|---|---|---|
| Live prices | “Open a WebSocket and setState” | Server conflation, viewport subscriptions, rAF coalescing, per-symbol store |
| Chart | Charting library with all the data | Interval per range, LTTB, overlay canvas, binary-search crosshair |
| Money | price * qty with toFixed(2) |
Decimal strings in, scaled bigint math, format at the edge |
| Orders | Disable the button while loading | State machine, idempotency key, unknown outcome, versioned updates |
| Reliability | “Reconnect if it drops” | Heartbeat, jittered backoff, snapshot + resubscribe, refetch orders, stale UI |
| Time | new Date().getHours() >= 9 |
Server calendar, America/New_York via Intl, server clock offset |
Conclusion: How to Design Robinhood
Start with rate limits. The server conflates each symbol, the client subscribes only to what is on screen, and a Map coalescer flushes to an external store once per frame. React renders the rows whose symbols changed and nothing else. The chart asks the server for a sensible interval, downsamples with LTTB, and redraws only an overlay canvas while you scrub.
Then treat money and orders with the seriousness the product needs. Money moves as decimal strings and is computed as integers. An order is a state machine with a client-generated idempotency key, a real “unknown” outcome, and server-driven transitions after acceptance. If you can explain why a timeout must retry with the same key, and why cancel is a request rather than a state, you’ve shown the interviewer you can build software that handles other people’s money.